The Challenge of Complexity in GitHub Actions
While GitHub Actions is incredibly powerful for automating CI/CD, workflow files (YAML) tend to become bloated as projects grow.
Trying to decipher “which job runs after which” or “is there a circular dependency?” from hundreds of lines of code takes more time than you might imagine.
The Benefits of Visualization
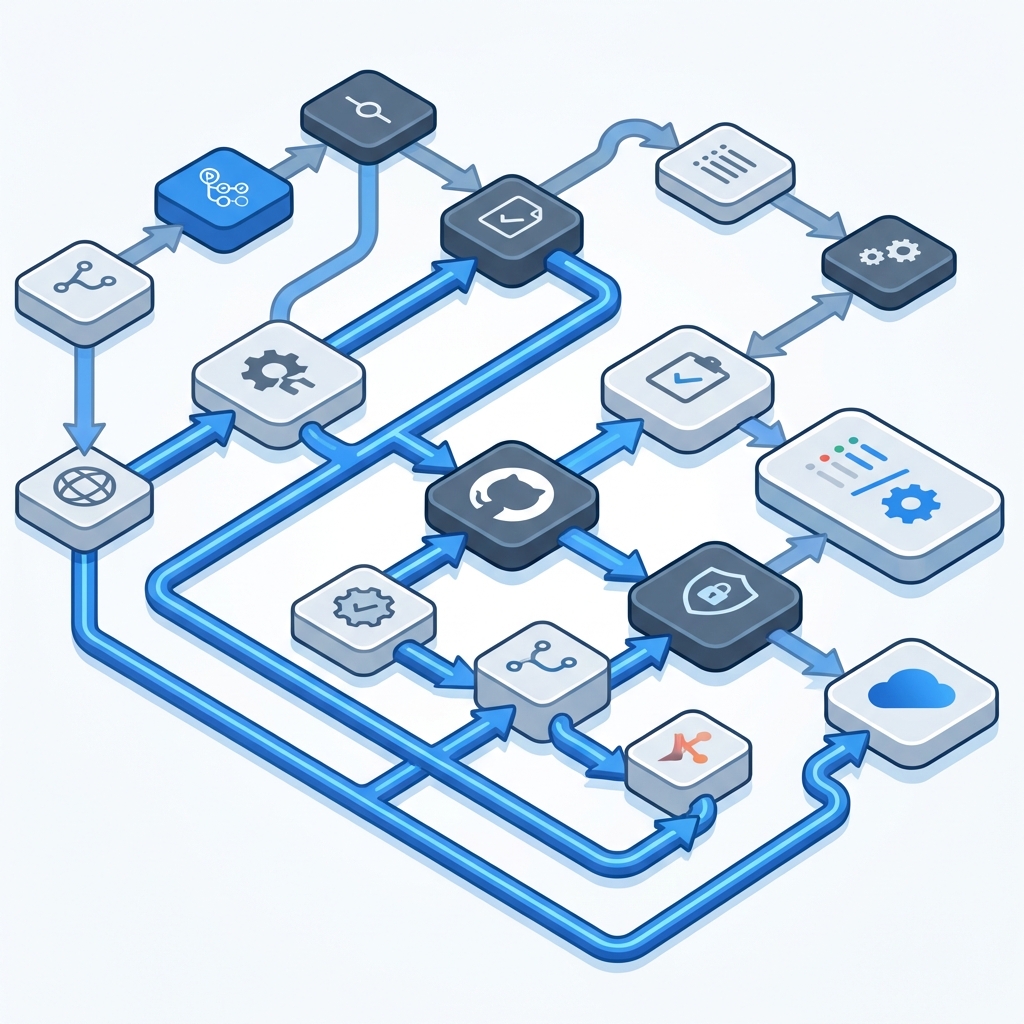
By displaying a workflow as a graphical diagram (DAG: Directed Acyclic Graph), you gain the following benefits:
- Immediate Overview of the Whole Picture: See at a glance the boundaries between jobs running in parallel and those running sequentially.
- Finding Bottlenecks: Identify jobs where dependencies are concentrated, providing material for considering how to speed up the pipeline.
- Building Consensus within the Team: Visually share the deployment flow with non-developers (PMs, QA, etc.).
Visualizing with Mermaid.js
Mermaid.js is an open-source library that generates diagrams from text. GitHub itself supports Mermaid, allowing diagrams to be rendered within Markdown.
graph TD
    Build --> Test
    Test --> Deploy
    Test --> Security-Scan
By simply writing in this format, you can output complex dependencies as beautiful diagrams.
Visualizing on DevToolKits
DevToolKits’ GitHub Actions Visualizer instantly converts your workflow YAML into a Mermaid-format diagram just by pasting it.
Since it operates entirely within the browser, you can safely use sensitive workflow files without ever sending them to a server.
💡 Tip: When an error occurs in a complex job configuration, we recommend first turning it into a diagram to re-confirm the execution order.